


VisitJourney
Follow in Matomo how visits move on from the entry page through pages, events and goals, and which steps come before an enquiry or an order, as an interactive flow chart.
Plugin page · from €49/month Try the live demo ↗
Overview
VisitJourney shows in Matomo which paths visits take through your website: step by step forwards from the entry page and backwards from every goal. Page views, selected events and goals are equal steps of a path. You find the reports under Behaviour → Visit Journey.
Features
- Paths from the entry page: a flow chart shows where visits go after their first page, with the share that continues or exits. Choose 5 to 50 entries per step and show or hide steps with + Step and ×. Rare entries are summarised as "(Others)", with their number.
- Paths to the goal: for every goal and for ecommerce orders, the steps before the conversion, plus the top sequences with conversions, share and revenue. A click on a sequence highlights exactly that path in the chart. The widget also appears on every goal's page and on the ecommerce overview.
- Explore: point at an entry and the connected paths are highlighted. A click pins the highlight; Esc or a click elsewhere releases it. A click on a column header lists up to 500 entries of the step, and the CSV export contains all of them.
- Many goals, your own dashboards: the goal picker looks like Matomo's own fields and adds a search field once a website has eight goals or more. On a dashboard every widget keeps its own goal, steps and entries, and two to three steps fit a half-width dashboard column. On the report pages Matomo remembers your choices and the last goal you picked for each website.
- Your page structure: pages appear by URL or page title and can be grouped by rule, such as all pages under
/products/as "Product page". Events appear only for the categories you enable. - Export and API: top sequences and the entries of a step as a CSV file with column names in your language, the top sequences also in email reports, plus four API methods.
- Dark mode and two languages: the interface is available in English and German and follows Matomo's dark mode.
How counting works
- Paths from the entry page count visits, on the day of their last action, like Visitors → Overview.
- Paths to the goal count every conversion individually, on its own day, like the Goals report.
- Identical steps in a row, such as a reload, count as one step.
- Downloads, outlinks, site search and events that are not enabled create no step and do not interrupt the path.
- Every path describes one visit. The plugin does not join paths across several visits.
- Weeks, months and years are the sum of their days. After a settings change they show the new paths too, once the next archiving run has finished.
Large instances
Paths are built during Matomo's archiving, never when a report is opened. Size limits per website and day keep the memory needed in check. If you like, the plugin processes a sample above a number of visits per day that you set, and extrapolates; the reports then say so. Paths are available for all visits and for segments that Matomo processes in advance.
Requirements
- Matomo 5.12 or later
- PHP 8.1 or later
- Matomo's archiving, as a cron job for high traffic
Installation
With one click through the Feinwerk connector or as a ZIP file, see Installing plugins.
License
Paid plugin under the Feinwerk EULA.
Use cases
- Paths, not single pages: Matomo counts how often each page is viewed. VisitJourney shows what happens next: step by step from the entry page, with the share that continues or exits.
- See what happens before the goal: For every goal and every ecommerce order, VisitJourney shows the steps before the conversion and the most frequent sequences, right on the goal's own page and on the ecommerce overview as well. A funnel for every goal, without defining the steps up front.
- Pages, events and goals in one path: A video start or a form event appears as a step of its own between the page views. Group product pages into one entry by rule so the paths stay readable.
- Calculated during archiving: Paths are built by Matomo's archiving, not when a report is opened. Size limits and optional sampling keep the effort in check even with very high traffic.
VisitJourney shows in Matomo which paths visits take through your website: step by step forwards from the entry page (Paths from the entry page) and backwards from every goal (Paths to the goal). Page views, selected events and goals are equal steps of a path. Matomo's own Transitions report shows the step before and after a single page; VisitJourney shows the whole path across several steps.
Step-by-step setup
How to install and activate VisitJourney is described in Installing plugins. The plugin needs Matomo 5.12 or later and PHP 8.1 or later, and no additional tracking code. Paths are calculated by Matomo's archiving. With a lot of traffic it should run as a cron job, as Matomo recommends (./console core:archive). The settings of a website can be changed by users with admin access to that website, the limits for the whole instance only by super users. Everyone who can view the website can see the reports.
1. Decide how pages are named
Open Administration → Websites → Manage and click Edit (pencil icon) next to the website. Further down the form you find the VisitJourney fields. Under Show pages by you choose how pages appear in a path:
- URL: the path without domain, parameters and anchor, such as
/products/hiking-boot-alpine. This is the default. - Page title: the title of the page. Pages without a title appear as "(no title)".
2. Group pages
Without a rule, every product page is an entry of its own and the rarer ones end up in "(Others)". With a rule you see instead how many visits reach a product page at all. Under Group pages you add rules made of a regular expression and a Label:
^/products/with the labelProduct page: all product pages become one entry.^/blog/.+with the labelBlog article: all articles under/blog/become one entry, while the overview page/blogstays on its own.^/magazine/([^/]+)/with the labelMagazine: $1: one entry per magazine section.$1to$9stand for the parts of the pattern in brackets.^shop\.example\.com/with the labelShop: all pages of a second domain that is tracked in the same website.
How patterns are checked: a pattern that starts with ^/ applies to the path of the page including its parameters, such as /products/tent?colour=blue. This also holds when an inline modifier such as (?i) comes first or the pattern starts with a group, such as ^(?:/blog/|/magazine/). All other patterns apply to the URL without protocol and without "www.", so to domain, path and parameters, such as shop.example.com/products/tent. Upper and lower case are ignored. If you show pages by Page title, the patterns apply to the title. Rules are checked from top to bottom, and the first one that matches names the page. Pages that match no rule keep their URL or title. You can add up to 100 rules; a pattern has at most 500 characters, a label at most 200.
3. Choose the events that count as steps
Under Events shown as steps you enter the event categories that should appear in a path. For each entry you pick the Comparison (exactly or regular expression) and under Show what the path displays: category only (such as "Event: Video") or category and action (such as "Event: Video / Play"). Without entries, no events are shown.
Only add events that matter for the path, such as video starts, a product configurator or form steps. Scroll or technical events would cut every path into many small steps. You can add up to 50 entries.
4. Save and calculate the past
Click Save. On the first save and after every change, the plugin schedules the paths of the last 30 days to be recalculated. A notice names the period and the command for older days, already filled in with the right website and dates. The next archiving run does the recalculation. After that these days show the new paths, in weeks, months and years as well, and every new day is added by itself.
To recalculate older periods, run this in the Matomo directory, here for the website with ID 1 and the first nine months of the year:
./console core:invalidate-report-data --sites=1 --dates=2026-01-01,2026-09-30 --plugin=FeinwerkVisitJourney
./console core:archive
The first command marks the paths of those days for recalculation, the second is Matomo's normal archiving. If your archiving runs as a cron job anyway, the first command is enough: the paths appear after the next run. If a report has no data yet, super users also find the matching command right in the report.
Only days whose raw data Matomo still has can be recalculated. If Matomo has already deleted old raw data (Administration → Privacy → Anonymize data, section Regularly delete old raw data), paths can no longer be calculated for those days.
5. Read the paths from the entry page
You find the reports under Behaviour → Visit Journey. Paths from the entry page shows one step per column: Step 1 · Entry, Step 2 and so on. Every entry is a page, an enabled event or a goal, and the width of the bands is the number of visits. Each column header shows the total and the share that continues or exits. Inside each entry, the hatched part shows the exits.
- Set the size: with Steps and Entries per step (5, 8, 10, 15, 20, 30 or 50) you decide how much the chart shows. + Step to the right of the last column shows one more step; the × in the header of the last column hides it again.
- Highlight paths: point at an entry and all connected paths are highlighted while the rest fades. The tooltip shows visits, share of the step, Continue and Exit. A click pins the highlight. A second click, Clear highlight, Esc or a click elsewhere releases it.
- Step details: click a column header to see the entries of that step with visits, share, Continue and Exit, not only the ones shown in the chart, up to 500 on screen. Export delivers all entries as a CSV file, with column names in your language.
- "(Others)": "(Others, 37)" groups the 37 rarer entries of a step. If it says "and more", rare paths were already summarised during archiving.
6. Read the paths to the goal
Paths to the goal is a funnel for every goal, without defining the steps up front. It shows the steps before the conversions of a goal, counted backwards from the goal: on the right the Goal column with the conversions and, for goals with revenue, the revenue, to its left 1 step before, 2 steps before and so on. Pick the Goal at the top. From eight goals on, the goal picker has a search field; on websites with ecommerce, the Ecommerce order is listed first.
- "(Start of visit)" means the visit had no earlier step. The column header shows the share of conversions whose visit started at that point.
- Tooltip: it shows the conversions through this step and their share of all conversions of the goal.
- Top sequences: below the chart you find the Top sequences before the goal: the most frequent sequences as coloured steps with conversions, share and revenue. Ten rows are visible, Show all shows up to 100. A click on a row highlights exactly that path in the chart; a second click, Clear highlight or Esc releases it. "…" at the start of a sequence means the visit may have had earlier steps. Export delivers the table as a CSV file.
- On the goal's own page: the same widget also appears on the page of every goal under Goals and, for orders, under Ecommerce → Overview, with the goal fixed.
7. Add it to a dashboard
When you add a widget to a dashboard, you find the widgets Paths from the entry page and Paths to the goal under Behaviour, the widget Paths to "…" for every goal under Goals, and the widget for orders under Ecommerce. Every widget keeps its own goal, steps and entries, also after a reload. That way the paths to the contact enquiry and the paths to the order sit side by side. Each widget remembers its goal per website, because every website has goals of its own.
On a dashboard the columns of the chart move closer together: two to three steps fit a half-width dashboard column, and longer paths scroll sideways inside the widget. Open the full report takes you to the report page.
On the report pages, Matomo remembers your choices: steps and entries per step for each report and the last goal you picked for each website. Nothing is stored for visitors who are not signed in, such as viewers of a public dashboard.
8. Optional: limits for large instances
Super users set how much the plugin stores under Administration → System → General settings, in the Visit Journey section. The defaults suit most instances:
- Steps from the entry page (default 6, 2 to 10) and Steps before a goal (default 5, 1 to 10): the maximum number of steps you can pick in the report later.
- Entry nodes (default 100) and Next nodes (default 25): how many of the most frequent first and next steps are stored individually; the rest goes to "(Others)".
- Size limit for paths from the entry page (default 20,000) and Size limit per goal (default 5,000): the maximum number of stored path nodes per website, day and segment.
- Sample above this many visits per day (default 0, all visits): if a website has more visits on a day, the plugin calculates that day from a sample of about this many visits and extrapolates. The same visits are picked on every run, and the reports then show the notice Sample: 10% of the visits, extrapolated with the actual share.
- Visits per database query (default 5,000): larger values need fewer queries and more memory.
- Days recalculated after changes (default 30, 0 to 365): how far back step 4 reaches.
New values apply to days archived from now on. Days archived before keep their paths until you recalculate them with the command from step 4.
Practical examples
Where do visitors go after the home page? An outdoor shop opens Paths from the entry page with Entries per step set to 8. In step 1 the home page is at the top; in step 2 its visits split into hiking, climbing and the product pages. A large hatched share on a category shows where visitors stop clicking, and a click on the header of step 2 lists every entry of that step.
Which paths lead to an order? With the rule ^/products/ as "Product page", hundreds of product pages become one step. Under Paths to the goal you pick the Ecommerce order. The top sequences show whether buyers tend to reach the basket via home page and category or land directly on a product page, with the revenue per sequence.
What comes before a contact enquiry? For the goal Contact enquiry, the top sequences show which pages prospects read first, such as case studies, prices or a guide. A click on a sequence highlights the path in the chart, and the tooltip shows how many conversions in total came through the same step.
What blog readers do next. With the rule ^/blog/.+ as "Blog article", every entry through an article lands in one entry. Paths from the entry page then shows how many readers click on after the article, into the shop or to the newsletter sign-up, and how many leave straight away.
Events in the path. You enable the event category Video with category and action. The path then shows "Event: Video / Play" between the page views, and you see whether visitors go on to a product page or to the contact page after the video.
Goals as steps along the way. Goals are steps just like pages and events. Under Paths to the goal for the Ecommerce order you therefore also see how many orders came after a newsletter sign-up in the same visit.
The paths of one channel. With a pre-processed segment such as Channel Type is Search Engines, VisitJourney shows only the paths of those visits. With ChannelGrouping this also works for your own marketing channels through the Channel Group segment dimension. Which search terms bring visitors to the entry pages is shown by SearchReport.
Sections of a website. With the free PageFilterReport you see how blog, shop and help perform on their own and where visits enter a section. VisitJourney shows where they go next. With one rule per section, such as ^/blog/ as "Blog", each section appears as one step.
Clean up first, then analyse. Bot visits often consist of a single page and inflate the exits right after the entry. TrackingSpamScore keeps such traffic out of new data, and the free DeleteVisitsFilter deletes bot visits that were already tracked. Matomo then reprocesses the affected days, paths included, in weeks, months and years as well.
Good to know
- How counting works: Paths from the entry page count visits, on the day of their last action, like Visitors → Overview. Paths to the goal count every conversion individually on its own day, like the Goals report. If Allow multiple conversions per visit is on for a goal, each conversion has its own steps. Weeks, months, years and custom date ranges are the sum of their days.
- Identical steps in a row count as one, so reloading a page does not make the path longer.
- What is not a step: downloads, outlinks, site search, content interactions and events that are not enabled do not appear in a path and do not interrupt it. Abandoned carts do not count as a goal. A footnote below the chart shows how many visits had no step at all.
- One path per visit: every path describes one visit. The plugin does not join paths across several visits of the same visitor.
- "(Others)" and size limits: the plugin summarises rare paths as "(Others)" so that archives stay small. On very busy days, paths that only become frequent late in the day can therefore be slightly undercounted. The notice Rare paths summarised below the chart says so when it applies.
- Segments: paths are available for segments that Matomo processes in advance. In the segment editor, that is the option segmented reports are pre-processed. For other segments the report shows a notice instead of a chart.
- Settings changed within the period: if you changed rules, days before and after the change can name pages differently. The notice Settings changed within the period points this out, and a recalculation with the command from step 4 brings all days to the same state.
- Today is re-archived by Matomo at regular intervals. On large instances, sampling also limits this effort.
- Many goals: every goal has a path tree of its own within its size limit, so the memory the archiving needs grows with the number of goals.
- Deleted goals appear in older periods as "Goal #3 (deleted)".
- API:
getForwardFlowandgetBackwardFlowdeliver the charts,getTopSequencesandgetStepEntriesthe tables. Every method needs view access to the website and exactly one period, which may also be a custom date range. - Stored data: paths live in Matomo's archives like the data of any other report. The plugin keeps each user's choices in Matomo and removes them when the user is deleted.
- Troubleshooting: if the report stays empty, check that archiving has run since the settings were saved and that the period lies within the recalculated days. Recalculate older periods with the command from step 4. More in Troubleshooting.
Technical reference
| Property | Value |
|---|---|
| Technical name | FeinwerkVisitJourney |
| Current version | 0.2.2 |
| Matomo | ≥ 5.12.0, < 6.0.0-b1 |
| PHP | ≥ 8.1.0 |
| License | paid |
| Database changes | none in the current version |
FAQ
How is VisitJourney different from Matomo's Transitions report?
Transitions shows, for a single page, what visitors did directly before and after it. VisitJourney shows whole paths across several steps, from the entry page or backwards from a goal, and includes enabled events and goals as steps of their own.
Is VisitJourney a funnel analysis?
Yes, just without steps defined up front. Paths to the goal shows for every goal and every ecommerce order which steps the conversions came through, also right on the goal's own page and on the ecommerce overview. Paths from the entry page shows per step how many visits continue and how many exit. So you don't have to guess beforehand which pages belong in the funnel: VisitJourney shows the paths visitors actually take.
Do I need additional tracking code?
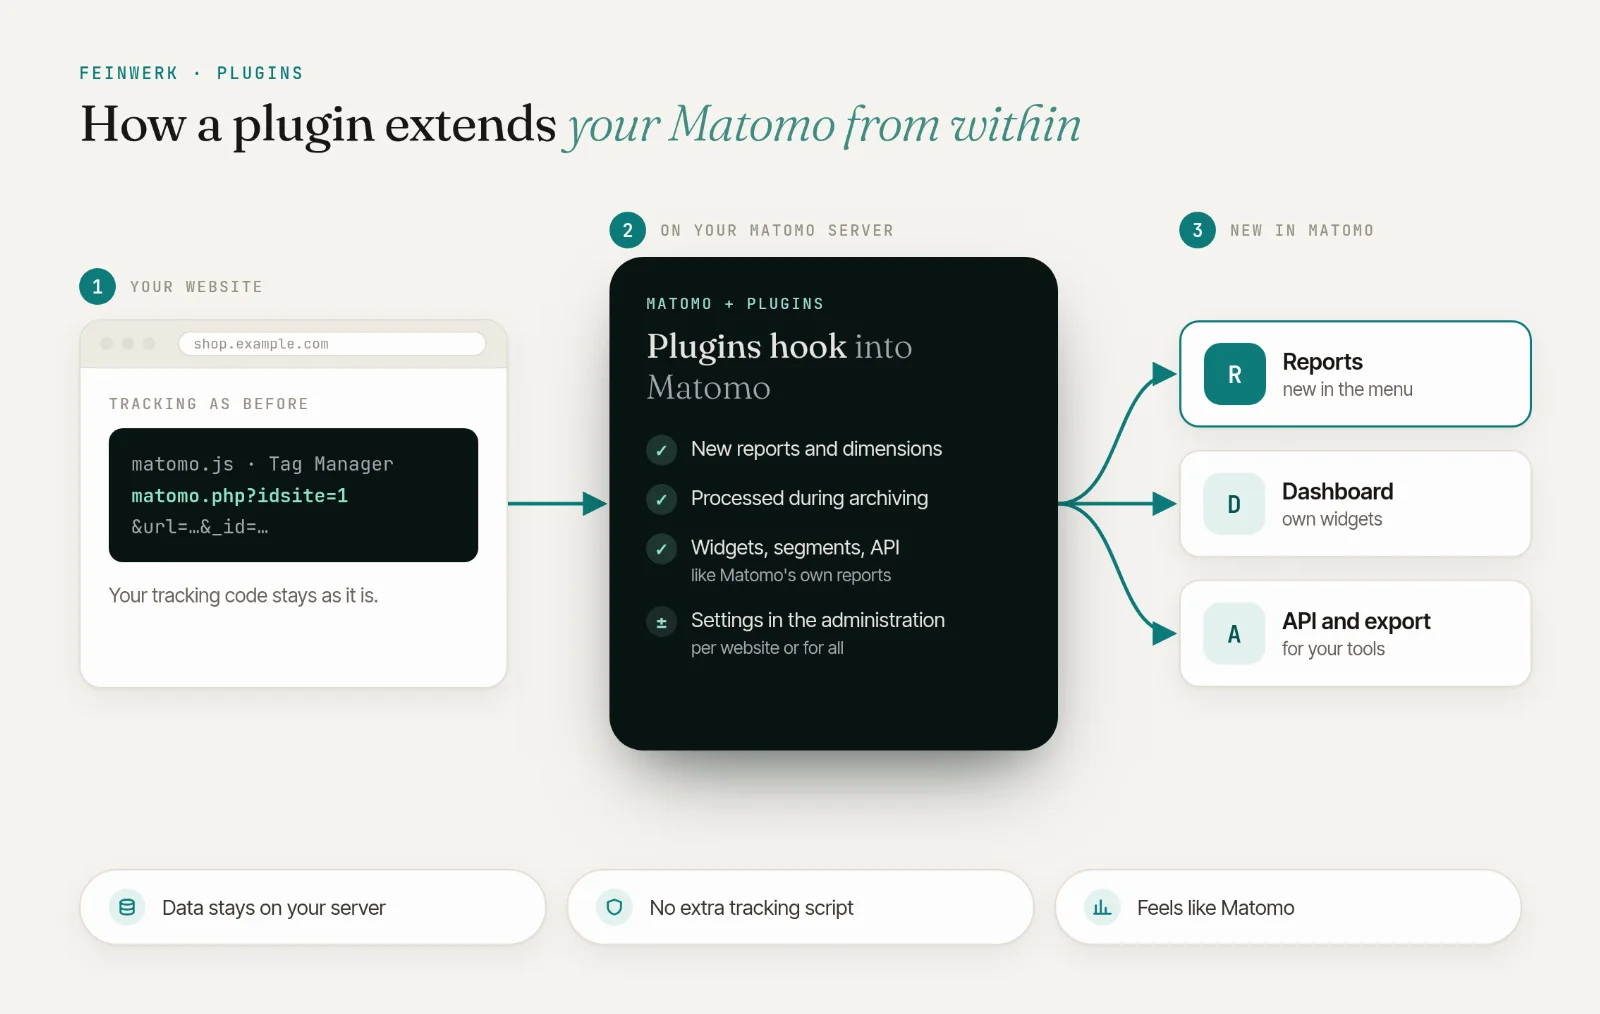
No. VisitJourney analyses the page views, events, goals and ecommerce orders that Matomo already records. Nothing changes in the tracking on your website.
Which events appear in a path?
Only events whose category you enable in the website settings, either with the category alone or with category and action. Without entries, no events are shown. That keeps frequent scroll or technical events out of your paths.
Can I see paths from before the installation?
Yes, as long as Matomo still has the raw data of those days. After you first save the settings of a website, and after every change, the next archiving run recalculates the last 30 days, weeks, months and years included. For older periods the plugin shows the matching console command, with your website and the date range.
Does VisitJourney work with segments?
Yes, with segments that Matomo processes in advance. In the segment editor that is the option "segmented reports are pre-processed". For other segments the report shows a notice instead of a chart.
Can I see the paths to several goals side by side on a dashboard?
Yes. Every widget keeps its own goal, steps and entries, so the paths to the order can sit next to the paths to the contact enquiry. Two to three steps fit a half-width dashboard column; longer paths scroll sideways inside the widget.
Is VisitJourney suitable for high-traffic websites?
Yes. Paths are built during archiving, never when a report is opened. Size limits keep the memory needed in check, and rare paths are summarised as "(Others)". For very large instances there is sampling, and the reports then point it out.
Does VisitJourney show paths across several visits?
No. Every path describes one visit, from its first page to its last step. If a visit had no earlier step before the goal, the path shows "(Start of visit)".
Can I export the numbers or send them by email?
Yes. Export the top sequences before a goal as a CSV file and add them to Matomo's email reports. The step details list up to 500 entries of a step, and their export contains all of them, with column names in your language. For your own analyses there are the API methods getForwardFlow, getBackwardFlow, getTopSequences and getStepEntries.
Who sees the reports, and who changes the settings?
Everyone who can view the website in Matomo sees the reports. The settings of a website can be changed by users with admin access to that website, the limits for the whole instance only by super users.
Which Matomo version do I need?
Matomo 5.12 or later and PHP 8.1 or later. The interface is available in English and German and follows Matomo's dark mode.